Tony Harmer – Creating Infographics with Illustrator
$20.00$40.00 (-50%)
Infographics visualize your data and help to tell the story behind it. In this course
Tony Harmer – Creating Infographics with Illustrator
Check it out: Tony Harmer – Creating Infographics with Illustrator
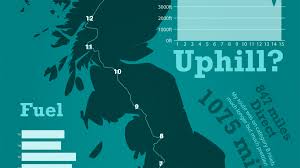
Infographics visualize your data and help to tell the story behind it. In this course, Tony Harmer shows how to design charts, graphs, and other infographic components in Adobe Illustrator.
He shares some sources of data that you can use in production, and reveals five key components of a great information design. He then takes you through the various types of tools, charts, and functions that you can use in infographic production, before wrapping up on how you can actually output your final product.
Topics include:
– Storytelling with data and graphic design
– Choosing the appropriate graph
– Getting data into Illustrator
– Defining the value axis for a chart
– Using graphic styles with charts
– Creating and applying a column design
– Making a rounded column
– Creating and applying a data marker
– Creating simple icons and color themes
– Exporting and printing the final product